This walkthrough demonstrates debugging an action in the Microsoft Dynamics NAV Windows client with the Microsoft Dynamics NAV Debugger. The purpose of this walkthrough is to familiarize you with what you can do with the debugger. It does not describe how to debug and fix a specific error.
 About This Walkthrough
This walkthrough illustrates the following tasks:
-
Setting a breakpoint on codeunit 80, Sales-Post, in the development environment.
-
Activating the Microsoft Dynamics NAV Debugger.
-
Posting a sales order so that the debugger breaks in codeunit 80, Sales-Post.
-
Using the debugger to:
-
View the parts of the debugger.
-
View variables and add watches.
-
Step through lines of code.
-
Add another breakpoint from the debugger.
-
Stop the current activity.
-
View the parts of the debugger.
Prerequisites
To complete this walkthrough, you will need:
-
Microsoft Dynamics NAV 2013 R2 with a developer license.
-
CRONUS International Ltd. demonstration database.
-
To verify that no other users are connected to the Microsoft Dynamics NAV Server instance. If other users are connected, then you might debug a session other than the one you want.
-
To verify that the user account that you use meets the requirements for setting breakpoints. For more information, see Development Environment (C/SIDE).
 Story
Story
Isaac is a business application developer working for CRONUS International Ltd. He has determined that there is an error in his code that posts sales orders. He wants to debug the scenario of posting a sales order. Isaac is not familiar with the Microsoft Dynamics NAV Debugger and wants to try all the functionality that the debugger offers.
 Debugging the Post Action on a Sales Order
Isaac starts by setting a breakpoint at the first line of code in the Sales-Post codeunit. Next, he activates the debugger, runs the code so that it breaks at his breakpoint, and then steps through lines of code in this codeunit and other codeunits and examines variables to try to find the error.
To set a breakpoint in the development environment
Open the Microsoft Dynamics NAV Development Environment. In Object Designer, choose Codeunit.
Select codeunit 80, Sales-Post, and then choose Design.
In the C/AL Editor, select the first line in the OnRun trigger.
On the Tools menu, choose Debugger, and then choose Toggle Breakpoint to add a breakpoint to the selected line of code.

To activate the debugger
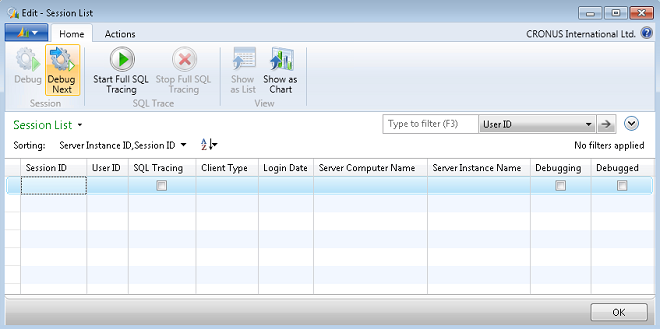
In Object Designer, on the Tools menu, choose Debugger, and then choose Debug Session.
The Session List page opens.
In the Session List page, on the Home tab, in the Session group, choose Debug Next.
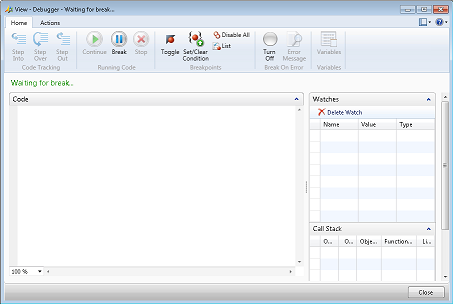
The Debugger page opens, but no session is currently being debugged, and no code is displayed in the code viewer.
To post a sales order and break in codeunit 80
Open a new Microsoft Dynamics NAV Windows client session.
In the Microsoft Dynamics NAV Windows client, in the Search field, enter Sales Orders, and choose the related link.
In the Sales Orders list, select any sales order for which you want to debug the Post action, such as sales order 101016, and then, on the Actions tab, in the Posting group, choose Post.
In the dialog box, select Ship and Invoice, and then choose the OK button.
Go to the Debugger window. The code viewer shows the OnRun trigger of codeunit 80. Execution stops on the first line of code in the OnRun trigger, where you set the breakpoint in the development environment.
To use the debugger
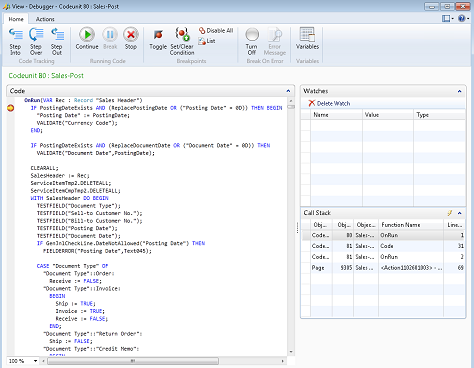
Now that you have hit a breakpoint in the code, you can become familiar with the parts of the Debugger page.
-
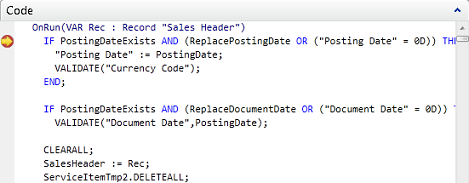
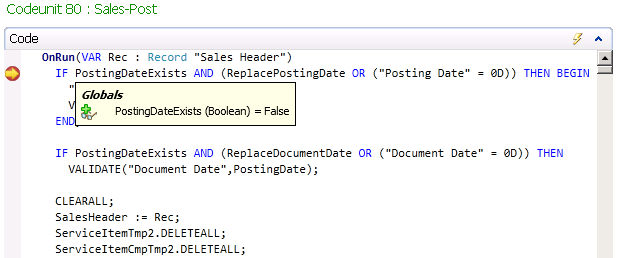
In the code viewer, the current line is identified by a yellow arrow in the margin. Breakpoints are identified by a red dot in the margin.
-
In the code viewer, you can point to a variable, field, or text constant to inspect the value.
-
In the Call Stack FactBox, you can view the function calls that led to the current line of code, starting with the Post action on page 9305.

-
In the code viewer, the current line is identified by a yellow arrow in the margin. Breakpoints are identified by a red dot in the margin.
On the Home tab, choose Variables.
The Debugger Variables List window displays all variables that are currently in scope, including the Rec variable.
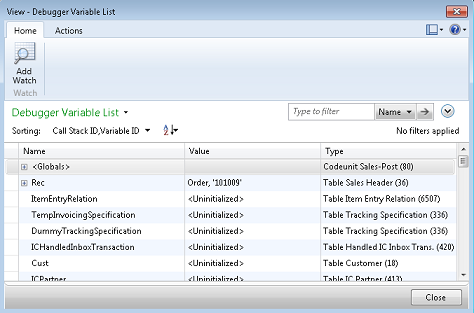
In the Debugger Variables List window, expand Rec, expand Fields, select a field such as Posting Date, choose Add Watch, and then choose the Close button. The Posting Date variable is added to the Watches FactBox. This is especially useful if there is a long list of variables in the Debugger Variables List window or if you want to view the value of a field in a record variable while you step through the code. Additionally, if you want to watch how the value of a variable changes, such as if you are in a loop, then it is useful to add the variable to the Watches FactBox.

In the Debugger Variables List window, you can also expand and view Keys and Globals on the record variable, and you can view the value of the Filter Group and Filters fields.
On the Home tab, in the Code Tracking group, choose Step Over to step over the current statement and on to the next statement.
Continue stepping over lines of code until the current line is the following.
 Copy Code
IF GenJnlCheckLine.DateNotAllowed("Posting Date") THEN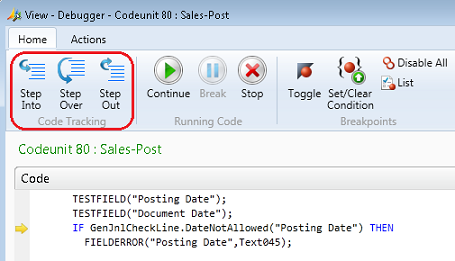
Choose Step Into to step into the DateNotAllowed function in codeunit 11. Codeunit 11 is added to the call stack in the Call Stack FactBox. The variable that you added to the Watches FactBox is still listed, but the value is <Out Of Scope>.
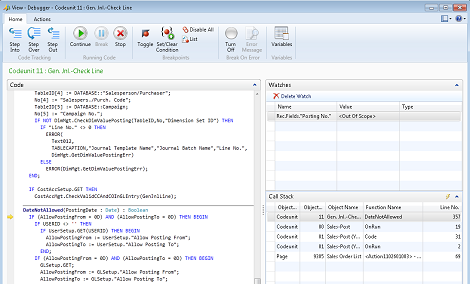
Choose Step Into and Step Over to step through the lines of the DateNotAllowed function. To step out of the DateNotAllowed function and go back to the OnRun function of codeunit 80, choose Step Out.
After you choose Step Out, codeunit 11 is no longer in the call stack. The code viewer displays the OnRun trigger of codeunit 80. The current line is the line that called the DateNotAllowed function.
In the code viewer, scroll down several lines to the following line of code.
 Copy Code
SalesSetup.GET;
Add a breakpoint to this line of code by doing one of the following:
-
Click in the margin to the left of the line of code.
-
On the Home tab, in the Breakpoints group, choose Toggle.
-
Click in the margin to the left of the line of code.
Scroll back to the current line of code, which is identified by the yellow arrow in the margin.
On the Home tab, in the Running Code group, choose Continue. Execution of code continues until the next breakpoint. The current line of code is now the
SalesSetup.GETline.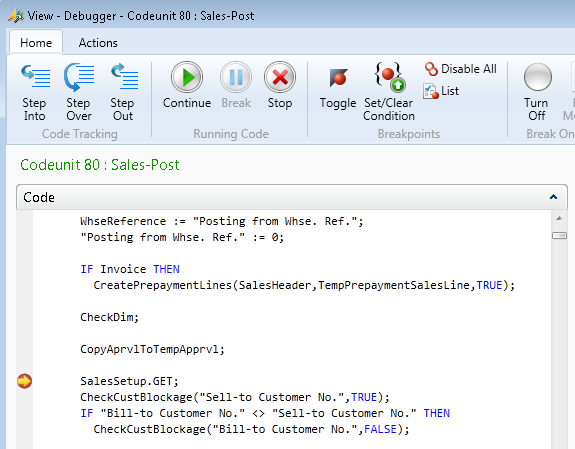
Choose Step Out to step out of codeunit 80. The call stack and the code viewer display codeunit 81 on the line of code that called codeunit 80.
 Copy Code
CODEUNIT.RUN(Codeunit::"SalesPost",SalesHeader);
The variables from codeunit 80 are no longer listed in the Debugger Variables List window. In the Watches FactBox, the value of the Rec.Fields."Posting No." variable is <Out Of Scope>.
On the Home tab, in the Running Code group, choose Stop. This stops execution as if the code hit an error. The following error message is displayed on the session that was being debugged: “The debugger stopped the current activity.” In this example, the sales order that you posted to start debugging is not posted. The error from the debugger when you chose Stop caused the transaction to roll back.
The Stop action is useful if you have to exit out of an endless loop. It is also useful if you performed several steps to set up data so that you could debug a scenario and do not want to continue executing code to commit and change that setup.
 Next Steps
After Isaac is finished debugging, some possible next steps are:
-
Delete or disable all breakpoints. For more information, see How to: Manage Breakpoints from the Debugger Breakpoint List.
-
Delete watches. For more information, see How to: Remove Variables from the Watches FactBox.
Isaac can also keep the breakpoints and watches in his breakpoint list so that he can use them in a future debugging session.


