When you create a report, you can add features such as formatting, custom filters, company logo, and company name to the report. Adding these features make the report readable and improves the visual presentation of the report. You will add these features to the report that you created in Walkthrough: Designing a Report from Multiple Tables.
 About This Walkthrough
This walkthrough shows you how to add custom filters, add company information, and format a report.
This walkthrough illustrates the following tasks:
-
Declaring the required variables.
-
Adding a custom filter to the request page. The filter will enable users to display or hide customer details.
-
Adding company information to the report.
-
Hiding or showing customer details.
-
Formatting the data.
-
Formatting the layout of the report.
-
Building and running the report.
Prerequisites
To complete this walkthrough, you will need:
-
To create a report by using Walkthrough: Designing a Report from Multiple Tables. If you have not created this report, you must create it before you start this walkthrough.
-
Microsoft Dynamics NAV 2013 R2 installed with a developer license.
-
The CRONUS International Ltd. demonstration database installed.
-
Microsoft Visual Studio 2012 installed.
Story
Viktor has created the report that was assigned to him in Walkthrough: Designing a Report from Multiple Tables. Viktor wants to improve the visual presentation of the report by adding the company name and company logo to the report. He will format the data and the layout of the report. The company name and the logo must be displayed on every page. On the request page, Viktor wants to enable users to filter the data by customer number and provide the option to hide or show detailed customer information.
Declaring the Required Variables
First, Viktor will declare the variables that are that are required to create the custom filter and add the company name and logo to the report.
To declare the variables
In the Microsoft Dynamics NAV Development Environment, in Object Designer, select the report that you created by using Walkthrough: Designing a Report from Multiple Tables (Report for Multiple Tables (50001). Choose Design to open Report Dataset Designer.
On the View menu, choose C/AL Globals to open the C/AL Globals window.
On the Variable tab, in the first row, in the Name field, enter ReportFilters. In the DataType field, choose the drop-down arrow, select Text, and then in the Length field enter 250.
In the second row, in the Name field, enter CompanyInfo. In the DataType field, choose the drop-down arrow, and then select Record. In the SubType field, choose the up arrow, and then select the Company Information table (79).
In the third row, in the Name field, enter ShowCustomerDetails. In the DataType field, choose the drop-down arrow, and then select Boolean.
Close the C/AL Globals window.
Adding a Custom Filter to the Request Page
Viktor will add an option control to the request page. The option control will enable users to show or hide detailed information for a customer. If the detailed information is hidden, only the customer’s number and name will be displayed on the report.
To add a custom filter
In Report Dataset Designer, on the View menu, choose C/AL code to open the C/AL Editor.
In the OnPreReport trigger, add the following code:
ReportFilters := Customer.GETFILTERS;. Close the C/AL Editor.In Report Dataset Designer, right-click the Cust. Ledger Entry DataItem, and then choose New to create a new row at the bottom of the Customer DataItem.
In the new row, in the Data Source field, enter the following code:
Customer.TABLECAPTION+':' + ReportFilters. In the Name field, enter Cust_ReportFilter.Repeat step 3 to create a new row at the bottom of the Customer DataItem.
In the new empty row, in the Data Source field, choose the AssistEdit button to open the C/AL Symbol Menu window. In the leftmost window, select ReportFilters, and then choose the OK button. In the Name field, enter ReportFilters.
On the File menu, choose Save to save the report.
In the Save window, make sure that Compile is selected, and then choose the OK button.
On the View menu, choose Layout to open the RDLC layout in Microsoft Visual Studio.
In the body section of the layout, select the List control and move the report down to create space at the top of the report.
On View menu, choose Report Data to display the Report Data pane.
On the DataSource node, under DataSet_Result, drag the Cust_ ReportFilter item to the space you that you created at the top of the body of the Report Designer.
Right-click the Cust_ReportFilter text box, and then choose Expression to open the Expression window.
In the Set expression for: Value box, replace the expression with the following expression:
=First(Fields!Cust_ReportFilter.Value). Choose the OK button.Select the Cust_ReportFilter text box, in the Visual Studio Properties pane, locate the Hidden property, choose the drop-down list, and then choose Expression.
In the Set expression for: Hidden box, replace the expression with the following expression:
=iif(First(Fields!ReportFilters.Value=""),true,false). Choose the OK button.On the Build menu, choose Build Web Site to build the project. Inspect the Output pane and make sure that there are no build errors. Close Visual Studio.
Adding Company Information
Viktor will add the company name and logo to the report.
To add a company name
In Report Dataset Designer, select a DataItem, and then in the dialog box that appears, choose the Yes button. The dialog box contains a message that states that the layout of the report is changed by another application.
In Report Dataset Designer, right-click the Cust. Ledger Entry DataItem, and then choose New to create a new row at the bottom of the Customer DataItem.
In the new row, in the Data Source field, choose the AssistEdit button to open the C/AL Symbol Menu window.
In the leftmost box, select DATABASE. In the middle box, select Functions. In the rightmost box, select COMPANYNAME. Choose the OK button.
In the Name field, enter CompanyName.
Save and compile the report. On the View menu, choose Layout.
In the Report RDLC layout in Visual Studio, on the View menu, choose Report Data.
In the Report Data pane, right-click the DataSource node, choose Refresh, and then verify that the CompanyName report item appears in the list under the DataSource node.
Drag the CompanyName report data item to the Report Header section of the report, build the report, and then close the Visual Studio Designer. The information that is on the header section will be displayed on every page on the report.
To add a company logo
In Report Dataset Designer, select a DataItem. In the dialog box that states that the layout of the report is changed by another application, choose the Yes button.
In Report Dataset Designer, right-click the Cust. Ledger Entry DataItem, and then choose New to create a new row at the bottom of the Customer DataItem.
In the new row, in the Data Source field, choose the AssistEdit button to open the C/AL Symbol Menu window.
In the leftmost box, select CompanyInfo. In the middle box, select FieldName. In the rightmost box, select Picture. Choose the OK button.
In the Name field, enter Picture.
On the View menu, choose C/AL Code.
In the C/AL Editor, in the OnInitReport Trigger, enter the following code.
 Copy Code
CompanyInfo.GET;
CompanyInfo.CALCFIELDS(Picture);
Close the C/AL Editor, save the report, and then compile the report.
On the View menu, choose Layout.
In Visual Studio, on the View menu, choose Toolbox.
In the Toolbox pane, drag the Image control to the header section of the report. Put the control where you want the company logo to be displayed, and then choose the OK button in the Image Properties window. Resize the image to the desired size.
Select the image control, in the Properties pane, in General node, set the following properties.
Property Value MIMEType
Image/bmp
Value
=First(Fields!Picture.Value, "DataSet_Result")
Source
Database
Under Size, set the Sizing property to FitProportional
On the main menu, choose Build, and then choose Build Web Site to build the project. Review the Output pane, make sure that there are no build errors, and then close Visual Studio.
Hiding or Showing Customer Details
In this section, Viktor will define visibility settings for the customer fields (address, telephone number, and email). These fields will be displayed or hidden depending on whether the Show Customer Details check box on the request page is selected. If the check box is not selected, only customer number and name will be displayed on the report.
To hide or show detailed customer information
In Report Dataset Designer, choose Yes in the dialog box that appears.
On the View menu, choose Request Page to open the Request Options Page Designer window.
In the first row, in the Caption field, enter Container, and then accept the defaults for the rest of the fields.
In the second row, in the Type field, choose the drop-down arrow, and then select Group. In SubType field, choose the drop-down arrow, and then select Group. In the Name field, enter Option. Accept the default for the Caption field.
In the next empty row, in the Type field, select Field. In the Name field, enter ShowCustDetails. In the Caption field, enter Show Customer Details.
In the SourceExpr field, choose the AssistEdit button, choose ShowCustomerDetails from the first box, choose the OK button, and then close the Request Options Page Designer window.
In Report Dataset Designer, create a new row at the bottom of the Customer DataItem. In the new row, in the Data Source field, choose the AssistEdit button to open the C/AL Symbol Menu window.
In the leftmost box, select ShowCustomerDetails. Choose the OK button. In the Name field, enter ShowCustomerDetails.
Save and compile the report.
On the View menu, choose Layout to open the RDLC layout in Visual Studio.
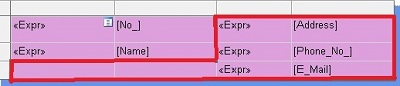
In the report layout, in the table that contains the customer data, in the last row, select the first two cells. In the third column, select the cells that contain the customer details data (address, telephone number, and email) values and captions. You can select multiple cells by holding down the Ctrl key and selecting the cells.
The following illustration shows the selected cells.
In the Properties pane, locate the Hidden property, choose the drop-down list, choose Expression, and then enter the following conditional expression in the Set expression for: Hidden box:
=iif(Fields!ShowCustomerDetails.Value,false,true). This expression replaces any expression in the box. Choose the OK button. This expression hides the customer details information unless the Show Customer Details option is selected on the request page. Note
Note When you select multiple cells, the Properties pane will display properties that are common to the selected cells. Build the modified report layout, inspect the Output pane and make sure that there are no build errors. Close Microsoft Visual Studio.
In Report Dataset Designer, select a DataItem, in the dialog box that appears, choose the Yes button.
On the File menu, choose Save. In the Save window, make sure that Compile is selected, and then choose the OK button.
In Object Designer, select the report (50001), and then choose the Run button to run the report.
The following illustration shows the Edit Report for Multiple Tables Request Page with the show details filter.
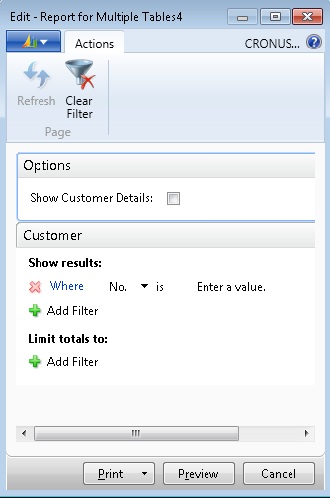
In the Where No. is filter, enter 01445544. Select the Show Customer Details option, and then choose the Preview button. Note that the company name and the company logo are displayed on the report and all customer information is displayed.
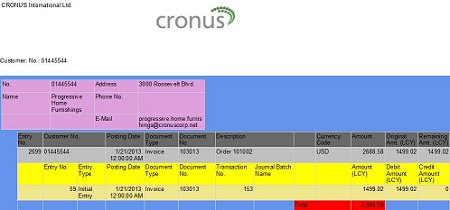
Note By default, the Show Customer Details option is not selected. The following illustration shows an example of the report with customer details.
Run the report again. This time, on the Request Page, do not select the Show Customer Details option. Note that only the customer ID and the customer name are displayed on the report.
Formatting the Data
By default, the DateTime fields in the report display the date in the 1/20/2013 12:00 am format, Boolean fields are displayed as true or false, and the amounts fields are displayed without commas. Viktor will format the DateTime values so that they are displayed in the 01/20/2012 (mm/dd/yyyy) format, Boolean values are displayed as Yes or No, and all the amounts are displayed in the #,###.## format. For example, 2,222.00. Later, the cells that display the amount values will be formatted to hide zero decimal values.
To format dates value
In the development environment, select Report Dataset Designer, choose View, and then choose Layout.
In the Visual Studio RDCL layout designer, select the posting date cell from the Cust Ledger Entry item, in the Properties window, locate the Format property, and then set the value to d.
Repeat step 2 to format all the dates in the report, save the changes, and then build the report.
To format a Boolean value
In the development environment, in Report Dataset Designer, select a DataItem, and then choose Yes in the dialog box that appears.
In the last empty row at the bottom of the Sales Header DataItem, in the Data Source field, enter the following expression:
FORMAT("Sales Header"."Prices Including VAT"). In the Name field, enter F_Prices_Including_VAT.Select the Prices Including VAT row, choose View, choose Properties, and then verify that the IncludeCaption Property is set to No. Save and compile the report.
On the View menu, choose Layout.
Right-click the cell that contains the Prices Including VAT value in the Sales Header item, and then choose Expression.
Delete the expression in the Set expression for: Value box.
In the Expression window, in the Category box, select Fields(DataSet_Results), and then in the Values box, double-click F_Prices_Including_VAT.
Verify that the Set expression for: Value box contains the following expression:
=Fields!F_Prices_Including_VAT.Value. Choose the OK button.
To format the amount values
In the table that contains the Customer Ledger Entry data, select the cell that contains the Amount field.
In the Properties pane, locate the Format property, select the drop-down list, and then choose Expression to open the Expression window.
In the Category box, select Fields(DataSet_Results), and then in the Values box, double-click Amount_CustLedgerEntryFormat.
Verify that the Set expression for: Value box contains the following expression:
=Fields!Amount_CustLedgerEntryFormat.Value. Choose the OK button.Repeat steps 1 through 4 and format the cells that contain Amount values as show in the following table. Make sure that you double-click the appropriate field in the Values box and verify that the Set expression for: Value box contains the expression for appropriate field.
Table Field Fields(DataSet_Results) Value to double-click Set expression for: Value box Customer Ledger Entry
Original Amt. (LCY)
OriginalAmtLCY_CustLedgerEntryFormat
=Fields!OriginalAmtLCY_CustLedgerEntryFormat.Value
Customer Ledger Entry
Remaining Amt.(LCY)
RemainingAmtLCY_CustLedgerEntryFormat
=Fields!RemainingAmtLCY_CustLedgerEntryFormat.Value
Detailed Customer Ledger Entry
Amount (LCY)
AmountLCY_DetailedCustLedgEntryFormat
=Fields!AmountLCY_DetailedCustLedgEntryFormat.Value
Detailed Customer Ledger Entry
Debit Amount (LCY)
DebitAmountLCY_DetailedCustLedgEntryFormat
=Fields!DebitAmountLCY_DetailedCustLedgEntryFormat.Value
Detailed Customer Ledger Entry
Credit Amount (LCY)
CreditAmountLCY_DetailedCustLedgEntryFormat
=Fields!CreditAmountLCY_DetailedCustLedgEntryFormat.Value
Sales Header
Amount
Amount_SalesHeaderFormat
=Fields!Amount_SalesHeaderFormat.Value
Note The field that displays the total amount uses the format of the Amount field in the Customer Ledger Entry table.
To hide zero decimal values
Right-click the cell that displays the amount in the Sales header item, choose Expression, in the Set expression for: Value box, replace the expression with following expression:
=Code.BlankZero(Fields!Amount_SalesHeader.Value). TheCode.BlankZero()function hides decimal values that are zero.Repeat step 1 to apply the
Code.BlankZero()function to all the amount fields.
Formatting the Report Layout
Viktor will format the report to make it visually appealing and he will resize the cell to make the values readable.
To format the report layout
Select the list control, in the Properties pane, under Fill set the BackgroundColor property to No Color.
Select all the rows in the customer item table and then set the BackgroundColor property to No Color.
Repeat step 2 and set the BackgroundColor property of all rows, for all tables, to No Color.
Ensure that the size of the list control and all tables do not exceed the width of the page.
Resize the table columns and rows so that the values in the fields fit in the table cells.
Drag a text box from the Toolbox to the header section of the report, right-click the text box, and then choose Text Box Properties.
In the Text Box Properties window, choose the General tab. In the Value field, enter a title for the report. For example, you can enter Report From Multiple Tables.
Under Sizing options, verify that the Allow height to increase option is selected, and then choose the OK button.
Select the text box that contains the title that you just created. In the Properties pane, expand Font, set the FontSize property to 14pt, and then set the FontWeight property to Bold.
Select the table that contains the customer data. In the Properties pane, expand the Padding node, and then verify that Left, Right, Top and Bottom properties are set to 0.
Repeat step 10 to set the padding for the tables that contain the Cust. Ledger Entries and Sales Header items.
In the Properties pane, set the properties for the controls and elements, as shown in the following table.
Control or element BoarderStyle FontFamily FontSize FontWeight Row that contains the Cust. Ledger Entry captions
Bottom - Solid
Not applicable
Not applicable
Not applicable
All controls on the report
Not applicable
Segoe UI
8pt
Not applicable
All caption cells
Not applicable
Not applicable
Not applicable
Bold
All data cells
Not applicable
Not applicable
Not applicable
Normal
Select the page header. In the Properties pane, expand the General node, and then set the Height property to 1.5in or 3.8cm.
In the Properties pane, set the Location properties for the controls as shown in the following table.
Control Top Left Table that contains the Cust. Ledger Entries data.
0.8in or 1,9cm
Not applicable
Table that contains the Sales Header data.
2.08in or 6cm
Accept the default
Select an area in the List control, in the Properties pane, expand Size, and then set the Height property to 2.85in or 7.24cm.
Select all the rows except the footer row in the Cust. Ledger Entries, and then set the BackgroundColor property to #f0f0f0.
Repeat step 16 to set the BackgroundColor property for all rows in the table that contain the Sales Header item.
In the table that contains the Cust. Ledger Entries item, select the columns that contain the amount fields, captions, and the total fields. Set the TextAlign property to Right.
Repeat step 18 to set the TextAlign property for the Prices Including VAT column in the Sales Header item.
In the table that contains the Cust. Ledger Entries table, select the merged cells that contain the CustomerNo caption and field value, and then set the TextAlign property to Center.
Repeat step 20 and set the TextAlign property for the merged cell that contains the Description caption and field value.
Select the Total caption and Total Amount cells, expand the Font property, and then set FontWeight to Bold.
Select all cells that contain an amount field, in the General node, make sure that the CanGrow property is set to True.
Select the last row in the Cust. Ledger Entry table, expand the BorderColor property node, and set the Top property to Black.
Building and Running the Report
You will now build and run the report. Note all of the features that Viktor has added to the report.
To build and run the report
On the Build menu, choose Build Web Site to build the project. Review the Output pane, make sure that there are no build errors, and then close Visual Studio.
In the development environment, in Report Dataset Designer, select a DataItem. In.the dialog box that appears that states that the layout of the report is changed by another application, choose the Yes button.
On the File menu, choose Save and in the Save window, make sure that Compile is selected. Choose the OK button.
In Object Designer, select the report that you just formatted (50001), and then choose the Run button to run the report.
On the request page, select the Show Customer Details option, and then choose the Preview button to view the report.
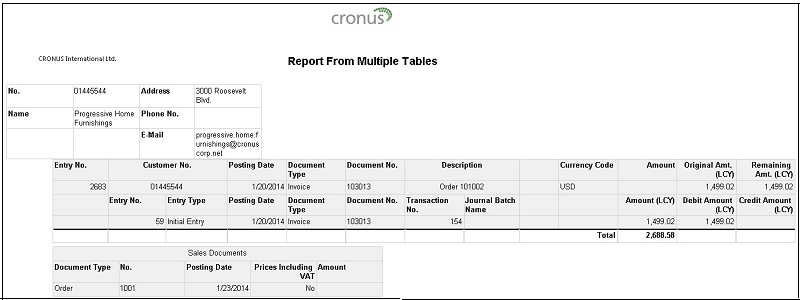
The following illustration shows an example of the completed and formatted report.